 INDEX
INDEX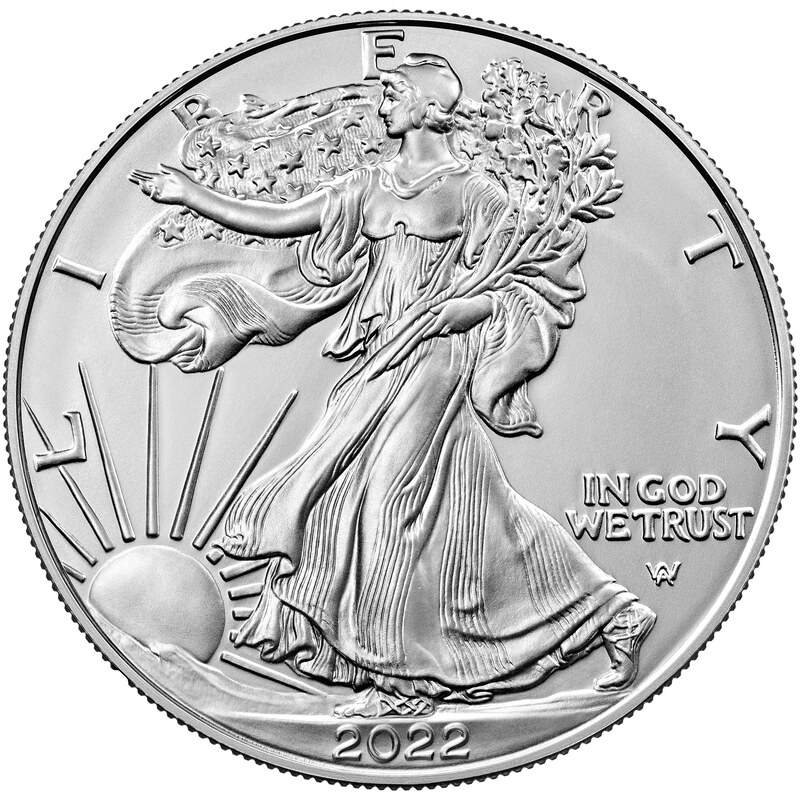
An American Silver Eagle contains 1.0000 troy oz of silver — about $57.42 at today's silver price.
Spot price as of October 21, 2026
About This Series
The American Silver Eagle has been the US Mint's flagship silver bullion coin since 1986. The obverse revives Adolph Weinman's Walking Liberty design from the 1916-1947 half dollar; John Mercanti's original heraldic eagle reverse ran for 35 years before being replaced in 2021 with Emily Damstra's landing eagle design. Each coin holds one troy ounce of .999 fine silver. Collectors pursue date runs and registry-quality coins; proof and burnished versions add complexity to the series. The 2008-W Uncirculated and 1995-W Proof are the standout rarities, with the 1995-W in particular crossing six figures at auction.
Specifications
1986–present
- Composition
- 99.9% Silver
- Fineness
- 99.9%
- Weight
- 31.10 g
- Diameter
- 40.6 mm
- ASW
- 1.0000 oz
- Years Produced
- 1986–present
Melt Value
Based on silver spot price of $57.42/oz
Spot price as of October 21, 2026
Mintage by year and mint
“Low mintage” marks a year at or below 10% of the median business-strike mintage for its own denomination; “Scarce for the series” marks one above 10% and at or below 25%. The median here is 6,301,986. That is a statement about how many were struck, not about how many survive or what collectors pay.
Low mintage years in this series: 2012 West Point (226,120), 2013 West Point (221,981), 2014 West Point (249,752), 2015 West Point (223,879), 2020 Philadelphia (240,000).
Show all 61 issues, 1986–2020
| Year | Mint | Business strikes | Proof | Relative mintage |
|---|---|---|---|---|
| 1986 | San Francisco | 5,393,005 | 1,446,778 | |
| 1987 | San Francisco | 11,442,335 | 904,732 | |
| 1988 | San Francisco | Not listed by NGC | 557,370 | |
| 1988 | San Francisco, West Point (combined annual total) | 5,004,646 | Not listed by NGC | |
| 1989 | San Francisco | Not listed by NGC | 617,694 | |
| 1989 | San Francisco, West Point (combined annual total) | 5,203,327 | Not listed by NGC | |
| 1990 | San Francisco | Not listed by NGC | Not published by NGC | |
| 1990 | San Francisco, West Point (combined annual total) | 5,840,210 | Not listed by NGC | |
| 1991 | San Francisco | Not listed by NGC | Not published by NGC | |
| 1991 | San Francisco, West Point (combined annual total) | 7,191,066 | Not listed by NGC | |
| 1992 | San Francisco | Not listed by NGC | 498,654 | |
| 1992 | San Francisco, West Point (combined annual total) | 5,540,068 | Not listed by NGC | |
| 1993 | Philadelphia | Not listed by NGC | Not published by NGC | |
| 1993 | San Francisco, West Point (combined annual total) | 6,763,762 | Not listed by NGC | |
| 1994 | Philadelphia | Not listed by NGC | Not published by NGC | |
| 1994 | San Francisco, West Point (combined annual total) | 4,227,319 | Not listed by NGC | |
| 1995 | Philadelphia | Not listed by NGC | 438,511 | |
| 1995 | San Francisco, West Point (combined annual total) | 4,672,051 | Not listed by NGC | |
| 1995 | West Point | Not listed by NGC | 30,125 | |
| 1996 | Philadelphia | Not listed by NGC | 500,000 | |
| 1996 | San Francisco, West Point (combined annual total) | 3,603,386 | Not listed by NGC | |
| 1997 | Philadelphia | Not listed by NGC | Not published by NGC | |
| 1997 | San Francisco, West Point (combined annual total) | 4,295,004 | Not listed by NGC | |
| 1998 | Philadelphia | Not listed by NGC | Not published by NGC | |
| 1998 | San Francisco, West Point (combined annual total) | 4,847,549 | Not listed by NGC | |
| 1999 | Philadelphia | Not listed by NGC | 549,769 | |
| 1999 | West Point | 7,408,640 | Not listed by NGC | |
| 2000 | Philadelphia | Not listed by NGC | Not published by NGC | |
| 2000 | West Point | 9,239,132 | Not listed by NGC | |
| 2001 | West Point | 9,001,711 | Not published by NGC | |
| 2002 | West Point | Not published by NGC | 647,342 | |
| 2003 | West Point | 8,495,008 | 747,831 | |
| 2004 | West Point | 8,882,754 | 801,602 | |
| 2005 | West Point | 8,891,025 | 816,663 | |
| 2006 | West Point | Varieties reported separately | Varieties reported separately | |
| 2007 | West Point | Varieties reported separately | 821,759 | |
| 2008 | West Point | Varieties reported separately | 700,979 | |
| 2009 | West Point | 30,459,000 | Not listed by NGC | |
| 2010 | West Point | 34,764,500 | 849,861 | |
| 2011 | San Francisco | Varieties reported separately | Not listed by NGC | |
| 2011 | San Francisco, West Point (combined annual total) | Not published by NGC | Not listed by NGC | |
| 2011 | West Point | Varieties reported separately | Varieties reported separately | |
| 2012 | San Francisco | Not listed by NGC | 281,792 | |
| 2012 | San Francisco, West Point (combined annual total) | 33,742,500 | Not listed by NGC | |
| 2012 | West Point | 226,120 | 877,731 | Low mintage |
| 2013 | San Francisco, West Point (combined annual total) | Not published by NGC | Not listed by NGC | |
| 2013 | West Point | 221,981 | 918,680 | Low mintage |
| 2014 | San Francisco, West Point (combined annual total) | 44,006,000 | Not listed by NGC | |
| 2014 | West Point | 249,752 | 745,394 | Low mintage |
| 2015 | Philadelphia, West Point (combined annual total) | 47,000,000 | Not listed by NGC | |
| 2015 | West Point | 223,879 | 707,518 | Low mintage |
| 2016 | Philadelphia, San Francisco, West Point (combined annual total) | 37,701,500 | Not listed by NGC | |
| 2017 | Philadelphia, San Francisco, West Point (combined annual total) | Not published by NGC | Not listed by NGC | |
| 2017 | San Francisco | Not listed by NGC | Not published by NGC | |
| 2017 | West Point | Not published by NGC | Not published by NGC | |
| 2018 | San Francisco | Not listed by NGC | Not published by NGC | |
| 2018 | West Point | Varieties reported separately | Not published by NGC | |
| 2019 | San Francisco | Not listed by NGC | Not published by NGC | |
| 2019 | West Point | Varieties reported separately | Not published by NGC | |
| 2020 | Philadelphia | 240,000 | Not listed by NGC | Low mintage |
| 2020 | West Point | Not published by NGC | Not published by NGC | |
| Mintages as published by NGC Coin Explorer, 2026-03 snapshot. Covers 1986–2020. NGC Coin Explorer does not list every date and mint, so this is what it publishes rather than a complete census. A further 70 listings it does publish are omitted here because NGC Coin Explorer records no single striking mint for them. | ||||